%E5%A4%A7%E3%81%8D%E3%81%84.png)
Demand data · US states · 2026
Matcha demand in the US is broadening rather than concentrating. In our own state-level search panel, 50 of the 51 US jurisdictions we track rose between July 4 and August 1, 2026, and the median state climbed from 19 to 29 on an index where the leading state is 100. The number of states scoring 30 or higher tripled in four weeks, from 7 to 21. If matcha still reads as a coastal specialty item in your market, the data has moved.
This is our own panel, and we publish the method alongside the numbers so you can judge them. The figures here are a fixed snapshot of our July 4 and August 1, 2026 pulls rather than a live monthly series. What follows is what the map says, what it does not say, and what a cafe should do about it.
Key takeaways
In this guide
Hawaii, California, Kansas, Texas, and Nevada posted the largest one-month gains in our August 1, 2026 panel. Hawaii rose 30 points to 82, California rose 23 to 67, Kansas rose 20 to 46, and Texas rose 19 to 49. These are index values against a leading state of 100, not volumes, and the mix of familiar coastal markets with Kansas is the point worth noticing.
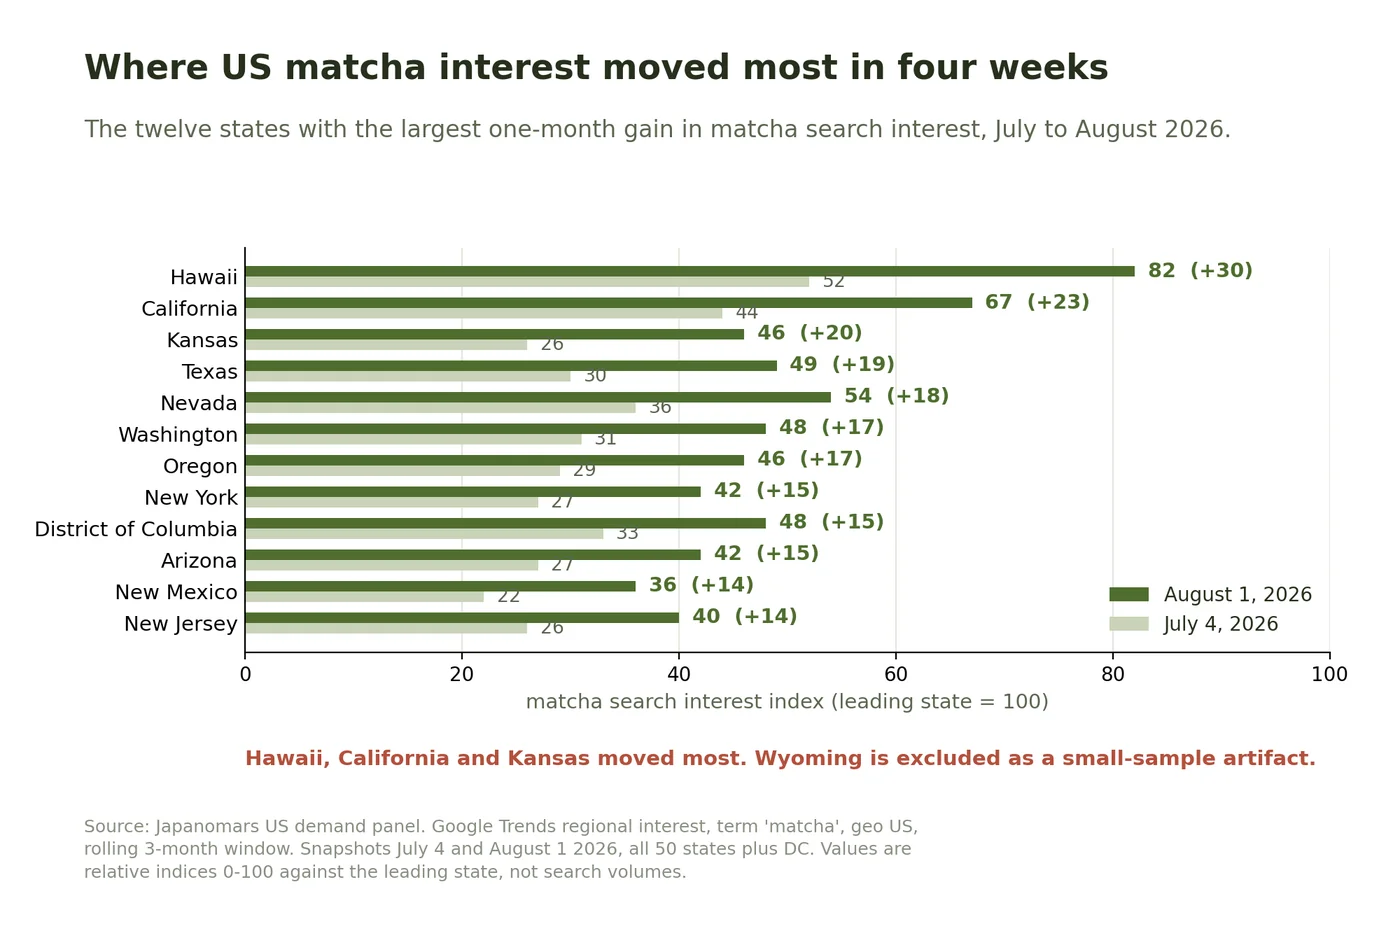
The top of the table is less useful than the middle of it. Wyoming reads 100 in both snapshots, and we would not build a sales plan on that. Very low population states produce small search samples, so their index swings hard and reverts hard. Hawaii at 82 is more credible, given a long-established Japanese food culture there, but it is still a small market in absolute terms.
The states that matter for a cafe operator are the ones in the middle of the distribution that moved a lot: Kansas at 46, Oregon at 46, the District of Columbia at 48, Nevada at 54, and New Mexico at 36. Four weeks earlier those five sat at 26, 29, 33, 36, and 22. None of them is a market anyone would have called a matcha market a year ago.
For a broader picture of what is driving the category, see our 2026 matcha market and supply outlook.
Yes, and this is the clearest finding in the panel. Between July 4 and August 1, 2026, the gap between the leading state and the typical state narrowed sharply. The median state moved from 19 to 29 against a fixed leader of 100, and the count of states scoring at least 20 went from 22 to 50 out of 51. Almost every state now registers meaningful matcha interest.
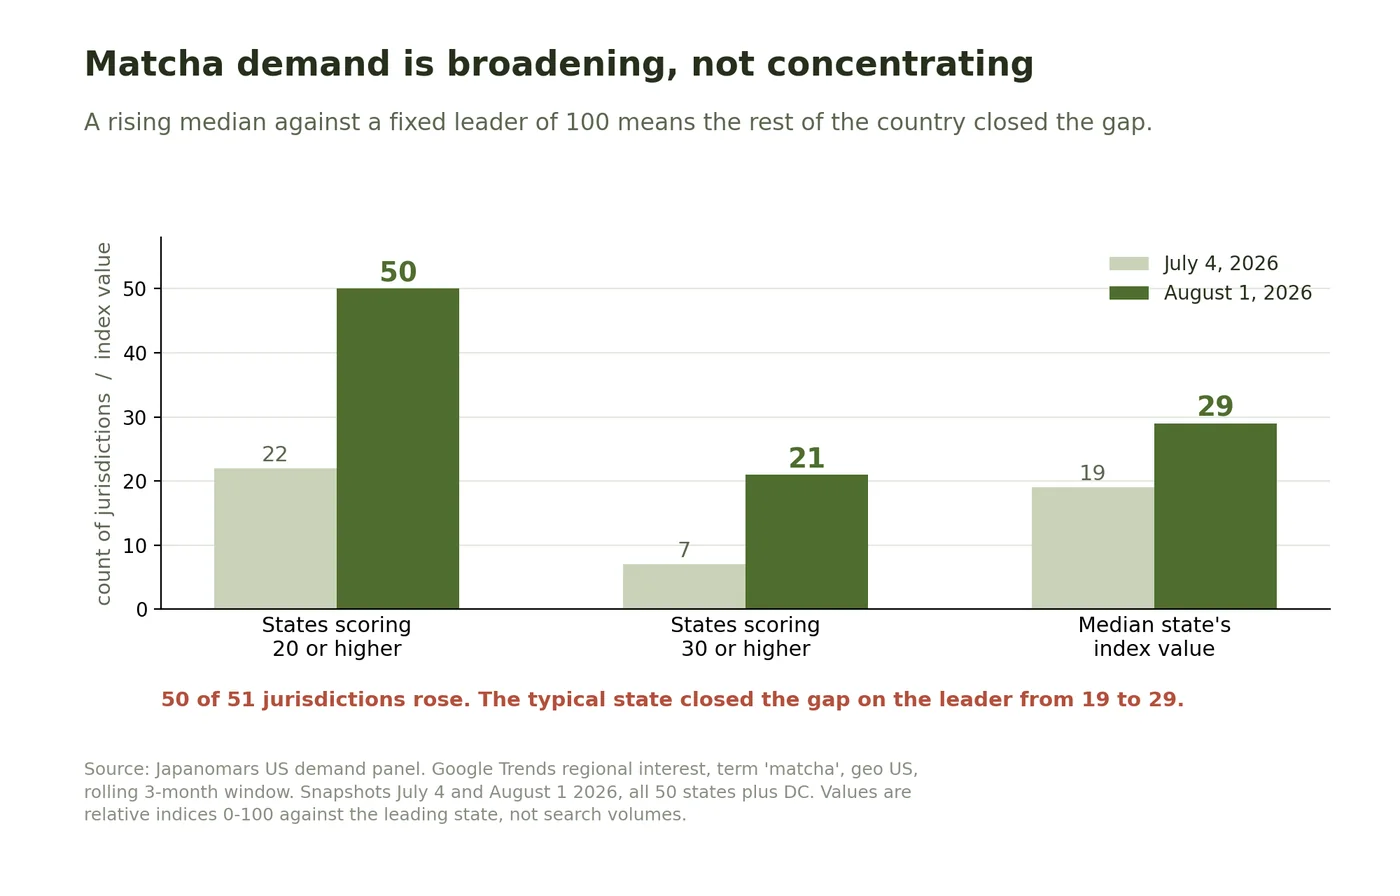
That distinction matters more than any single state's rank. Both snapshots are normalized so the top state equals 100, which means a rise in the median cannot be explained by the whole country getting busier. It reflects the rest of the country closing the distance on the leader. Matcha interest is becoming less concentrated geographically.
The independent corroboration is on menus. On February 19, 2026, Jack in the Box launched a matcha beverage lineup nationwide, including a Matcha Iced Latte and an Oreo Matcha Shake, making it one of the first US quick-service chains to run matcha at national scale. A category does not reach a QSR national rollout while it is still a coastal specialty.
The practical read for an operator in a secondary market: the question has shifted from whether local customers know matcha to whether your version is better than the drive-through version four miles away.
Nine states produce a stable business-to-business signal, and that number is the honest headline. Across both snapshots, only California, Massachusetts, Texas, Washington, Pennsylvania, Illinois, Florida, New York, and Ohio returned a non-zero value for "matcha wholesale" in both months. In the August panel, 39 of 51 jurisdictions returned no usable value at all.
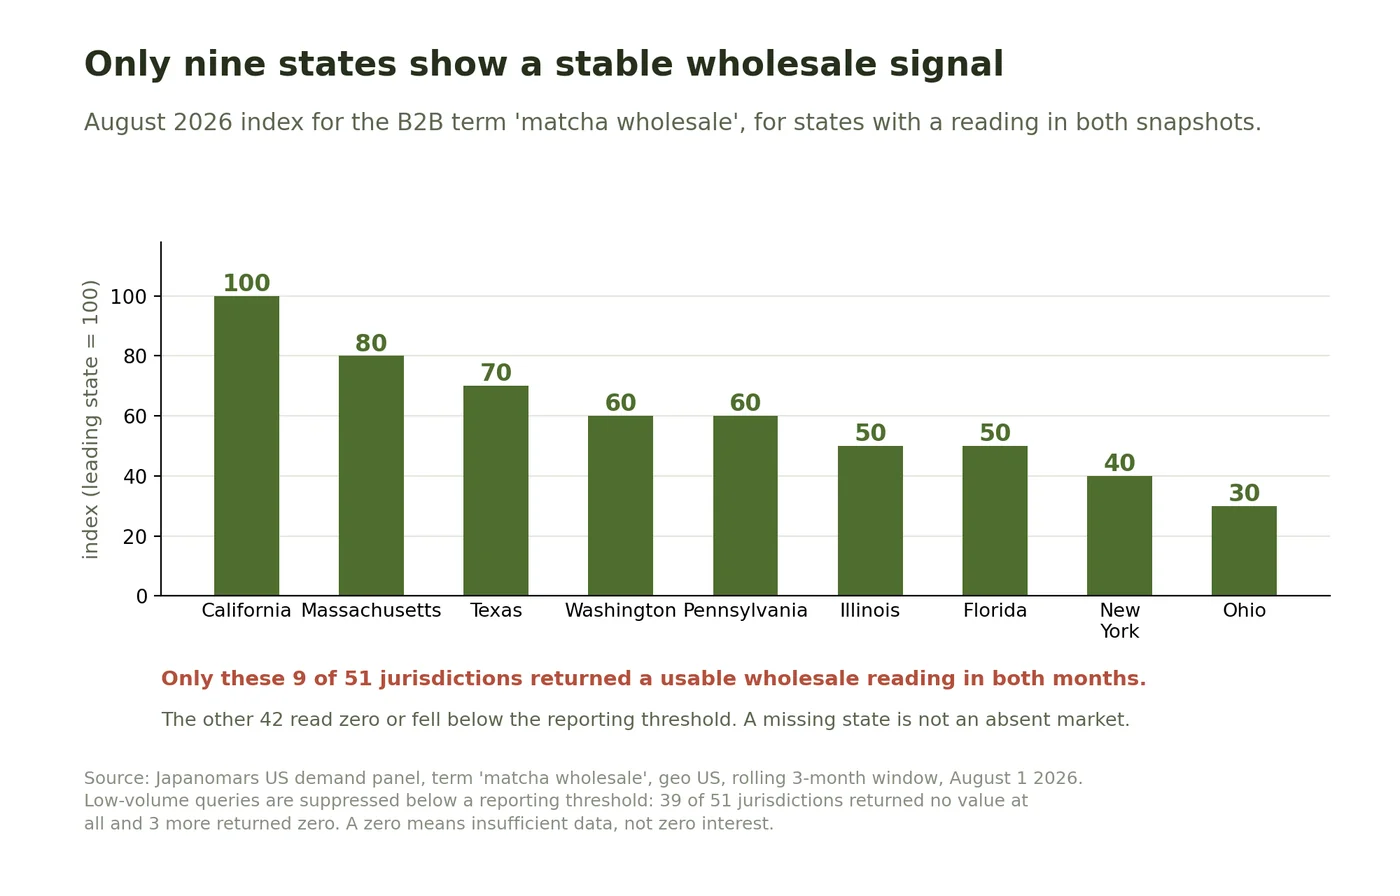
Among the nine, California indexes at 100, Massachusetts at 80, Texas at 70, Washington and Pennsylvania at 60, Illinois and Florida at 50, New York at 40, and Ohio at 30. Massachusetts gained 14 points month over month and Texas gained 4.
We would not lean on the month-to-month movement in this table, and we want to be direct about why. Between the two snapshots, Virginia moved from 58 to 0, Georgia from 41 to 0, and Colorado, Michigan, New Jersey, and North Carolina dropped out of the sample entirely. Those are not real collapses in wholesale interest. They are what a low-volume query looks like when it falls under the reporting threshold. State-level B2B search data is directionally interesting and individually unreliable.
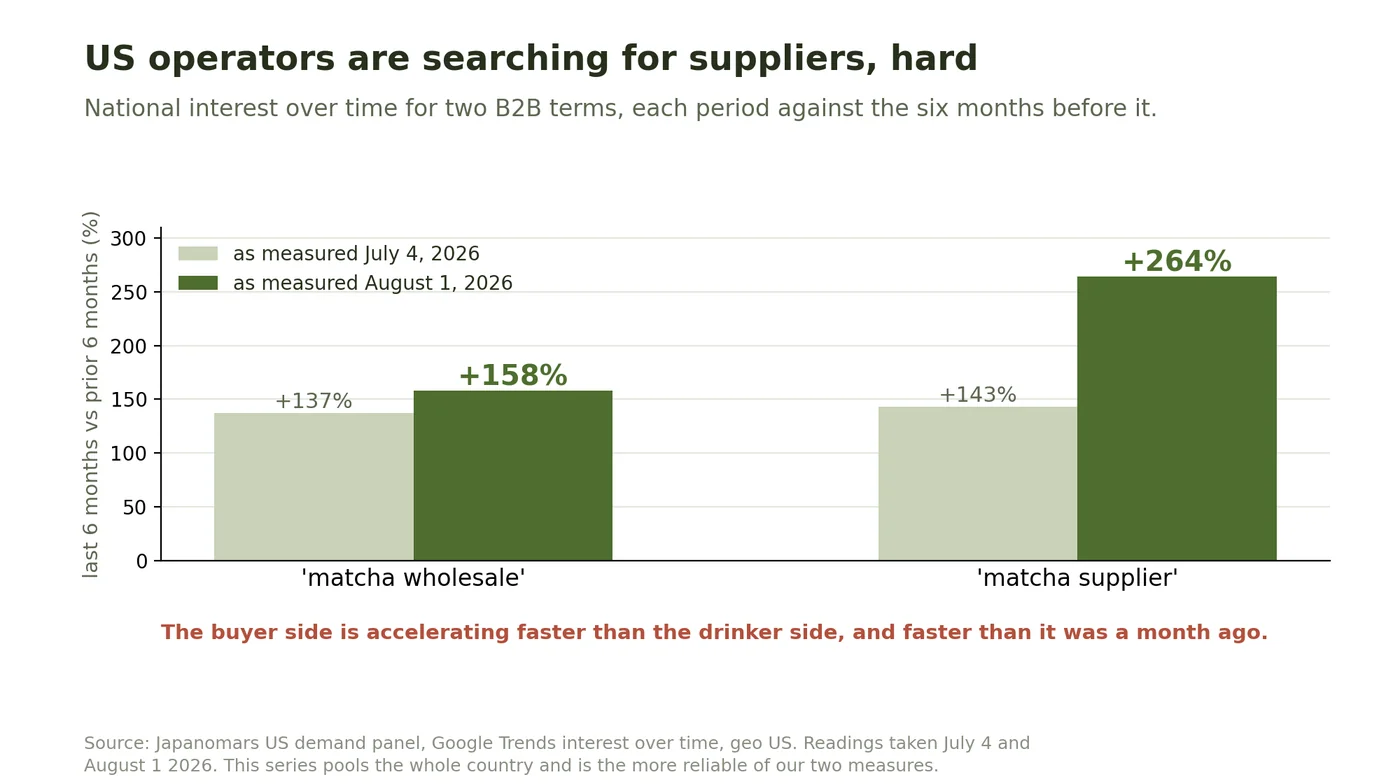
The national picture for the same terms is much sturdier, because it pools every state. Nationally, searches for "matcha wholesale" over the last six months ran 158% above the prior six months, and "matcha supplier" ran 264% above. Four weeks earlier those same measures read 137% and 143%. The operator side of the market is accelerating faster than the consumer side.
The US is not the hottest matcha market in the world, and this has direct consequences for what a US cafe can buy. In our August 2026 country panel for "matcha wholesale", Singapore indexes at 100, the Philippines at 76, Malaysia at 63, Indonesia at 62, Australia at 56, and the United States at 54. Canada and the United Kingdom follow at 51.
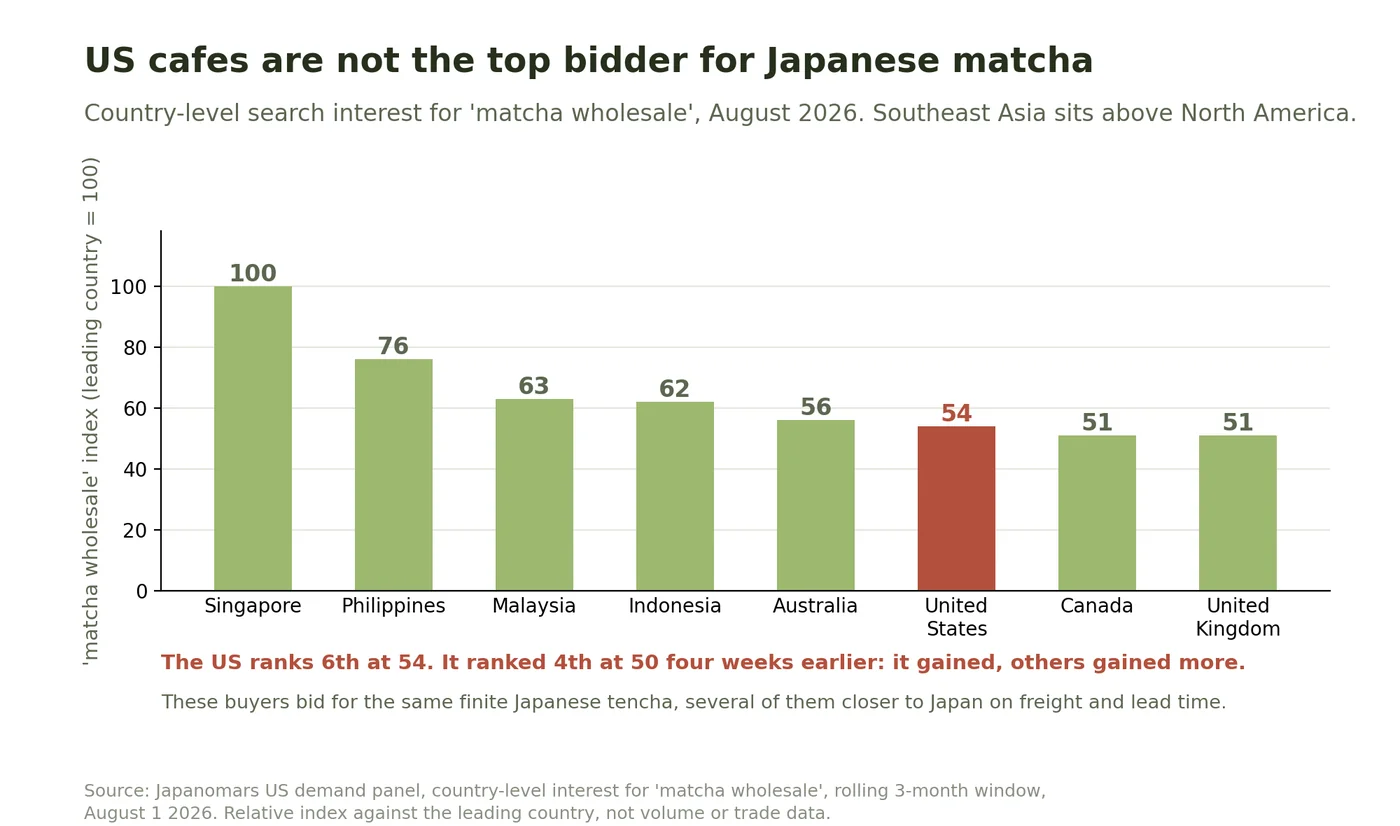
Southeast Asia sitting above North America is not a curiosity. Those buyers are bidding for the same finite volume of Japanese tencha that your supplier is trying to secure for you, and several of them sit closer to Japan on freight and lead time. When a Japanese producer allocates a limited spring harvest, a US cafe ordering 5 kilograms is competing against regional buyers with larger and earlier commitments.
The order in that list has also shifted. In our July 4 panel, the United States ranked 4th at 50. Four weeks later it ranks 6th at 54, having gained points while Indonesia and Australia gained more. Rising US demand does not automatically translate into rising US allocation.
Not easily, and the constraint is on the Japanese side rather than the American one. Japan's Ministry of Agriculture, Forestry and Fisheries reported that the 2025 first-flush crop produced 20,000 tonnes of aracha, down 10% year on year, from a harvested area of 22,300 hectares, down 5%. Yield per unit area fell 6% to 461 kilograms per 10 ares. The ministry attributed the shortfall largely to low minimum temperatures in Shizuoka from early April through early May.
The same release recorded a structural shift worth knowing: Kagoshima took first place nationally in first-flush aracha production for the first time. Japan's tea map is being redrawn while demand broadens.
Tencha, the shade-grown leaf that becomes matcha, has grown fast but from a small base. A December 2025 research paper prepared for Japan's House of Councillors on matcha supply capacity put tencha production at 5,336 tonnes in fiscal 2024, roughly 2.7 times the level of ten years earlier, while noting that tencha still accounts for only about 7.3% of Japan's total tea output. Converting a sencha field to tencha takes years and capital equipment, so that share moves slowly.
For what this has done to prices at auction, see our US matcha wholesale price and availability index, and for the buyer-side playbook during a tight year, our guide to sourcing during the 2026 shortage.
Use the consumer panel for menu decisions and the national B2B panel for timing. Those are two different questions and the data supports them unevenly.
If your state moved into the 30 to 55 band (Nevada, DC, Oregon, Kansas, New York, Arizona, New Jersey, Illinois, Massachusetts, Florida, New Mexico, Georgia), local demand has arrived recently enough that you are early rather than late. This is the band where adding a competent matcha program still differentiates you. Our guide to adding matcha to a cafe menu covers the build.
If your state sits below 30, the panel says interest is rising but thin. Start with one well-executed matcha latte rather than a five-item matcha menu, and watch your own sales rather than the index.
On sourcing, ignore your state's wholesale number entirely. With 39 of 51 jurisdictions producing no usable B2B signal, your state's reading tells you nothing about your ability to buy. The national trend is the actionable one, and it says the buyer side is moving quickly. Practically that means securing volume ahead of the spring auction rather than after it, since first-flush allocation is largely spoken for by the time prices are published.
Fix the supplier question before the demand arrives. A broadening demand map plus a constrained harvest is the condition under which cafes discover their supplier cannot scale with them. Our guide to finding and vetting a Japanese matcha supplier is the checklist we would use.
We publish the method because the numbers are only worth what the method is worth.
The panel pulls Google Trends regional interest for the terms "matcha" and "matcha wholesale", geography United States, on a rolling 3-month window, plus country-level interest for "matcha wholesale" and national interest-over-time for "matcha wholesale" and "matcha supplier". It ran on the first of each month through August 2026 and we retain every snapshot. We are not running new pulls at present, so the figures on this page are fixed at the August 1, 2026 reading. The two snapshots behind this article are dated July 4 and August 1, 2026, and cover all 50 states plus the District of Columbia.
Three limitations you should hold onto. First, every value is a relative index from 0 to 100 within its own query and window, not a search volume, so a state at 50 has half the search share of the leader, not half of anything absolute. Second, comparing two separately normalized snapshots tells you how the distribution changed, which is why we report median-against-leader and threshold counts rather than claiming a percentage rise in volume. Third, low-population states and low-volume queries fall below Google's reporting threshold and drop out, which is exactly what happened to six states on the wholesale term between our two snapshots.
Where we state a national growth figure, it comes from the interest-over-time series, which pools the whole country and is the more reliable of the two measures.
From the sourcing floor
Enquiries reach us from all sorts of states, and I want to be honest about one thing a search map cannot show: buying power. American buyers have plenty of it. In practice we have not had a case where matcha could not go to a US cafe because Europe or Southeast Asia had bought it first. The map tells you where the interest is; it does not tell you who ends up with the tea.
On our August 1, 2026 panel, Wyoming indexes highest at 100, followed by Hawaii at 82 and California at 67. We would treat Wyoming as a small-sample artifact. Among large markets, California leads on both consumer interest and wholesale search.
Yes. Nationally, US searches for "matcha wholesale" over the last six months ran 158% above the prior six months, and "matcha supplier" ran 264% above, as of our August 1, 2026 reading. Both figures rose from the July reading.
No, and this is the most common mistake we see. Allocation is decided in Japan against a constrained harvest, and Southeast Asian buyers currently index higher than the US on wholesale interest. Local demand affects how much you can sell, not how much you can buy.
Google Trends suppresses values for queries below a reporting threshold in a given region. "Matcha wholesale" is a low-volume B2B term, so 39 of 51 US jurisdictions returned no usable value in our August 2026 panel. A zero means insufficient data, not zero interest.
It is not on a fixed schedule. The panel ran on the first of each month through August 2026, and we are not running new pulls at present, so this page is a fixed snapshot of the July 4 and August 1, 2026 readings. If we resume monthly pulls we will say so in the changelog below.
It is reliable for direction and unreliable for magnitude. We use the national interest-over-time series for trend calls and the state panel for relative comparison, and we do not use state-level wholesale readings for sourcing decisions.
The state table behind this article is available as a machine-readable file: download the CSV (japanomars-us-matcha-demand-by-state-2026-08.csv). One row per state (51 rows including DC): pull date, time window, Google Trends interest for "matcha" (0 to 100, relative across states), interest for "matcha wholesale" (0 to 100), and the change in the wholesale score versus the previous monthly pull. Values are relative indices, not search counts. The file covers the July 4 and August 1, 2026 pulls. We are not adding further monthly pulls at present.
Quote freely with attribution. Suggested citation: Japanomars (2026). The US Matcha Demand Map: state-level search interest for matcha and matcha wholesale, August 2026 pull. https://www.japanomars.com/insights/us-matcha-demand-map-state-data. Please keep the pull date with any figure, and note that Google Trends scores are relative to the top state in each pull, so they should not be compared across pulls as absolute values.
We work farm-direct with growers in Sayama, Ibi, Ureshino, Yame, Kirishima and Chiran, and we can tell you honestly what is available for the volume you need before you commit to a menu.
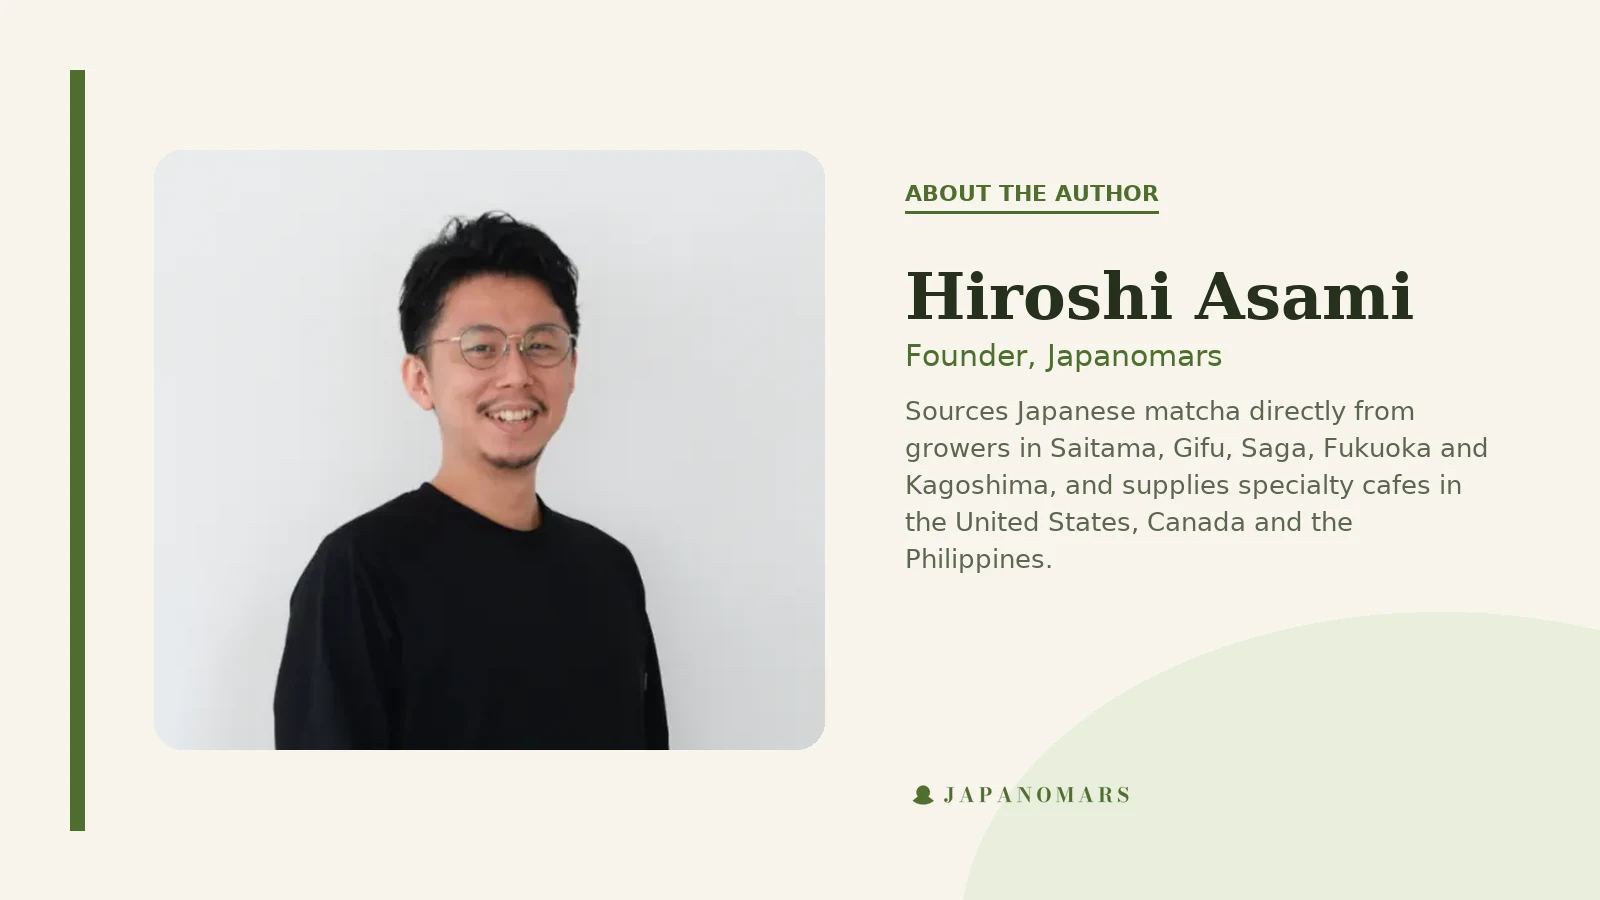
Hiroshi Asami is the founder of Japanomars, which exports Japanese matcha to specialty cafes in the United States and Canada. He buys directly from farms in Sayama, Ibi, Ureshino, Yame, Kirishima and Chiran, and has led four sourcing tours bringing overseas cafe owners to Japanese tea farms.
Demand figures are from the Japanomars US demand panel, built on Google Trends regional and interest-over-time data, snapshots dated July 4 and August 1, 2026. Japanese production figures are from Japan's Ministry of Agriculture, Forestry and Fisheries 2025 first-flush tea statistics and from a December 2025 research paper on matcha supply capacity prepared for the House of Councillors. The Jack in the Box launch is from the company's own February 19, 2026 announcement.
%E7%99%BD_%E5%A4%A7%E3%81%8D%E3%81%84.png)